


The Past is Prologue? With Respect to the "4% Rule," Be Careful
By John H. Robinson, Financial Planner (February 2026)
A few weeks ago, financial planner Andy Panko, CFA, CFP, EA posted the table below on LinkedIn to illustrate how the “4% Rule” for retirement spending might have held up for consumers who had the misfortune of retiring at the end of 1999 – right before the two brutal back-to-back bear markets in the stock market that saw the S&P 500 fall more than 50% both times and end 2009 30% lower than it was at the beginning of the decade.
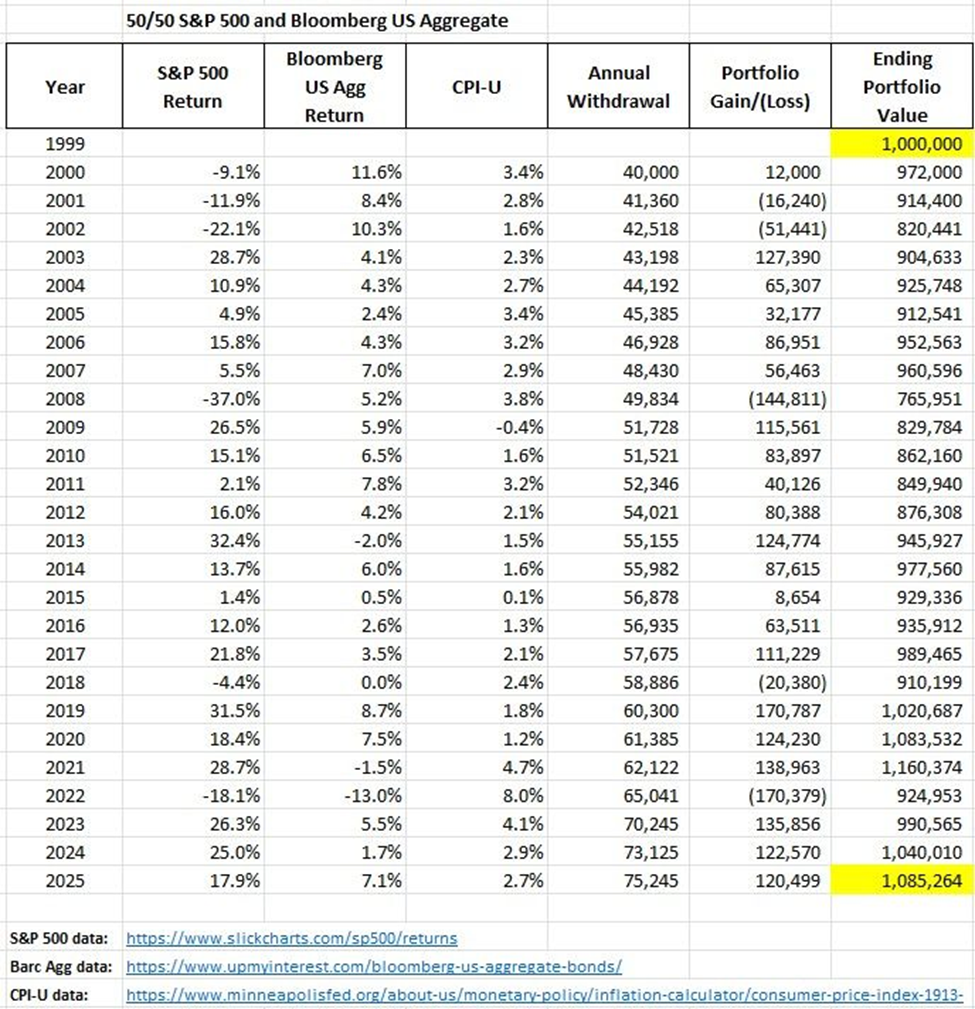
To produce the output, Andy followed the parameters set forth in Bill Bengen’s 1994 seminal paper that launched the 4% Rule, Determining Withdrawal Rates Using Historical Data (Journal of Financial Planning, January 1994). The assumptions include an initial portfolio value of $1 million with 50% of the portfolio invested in the S&P 500 Index and 50% in intermediate treasuries. The withdrawal rate began at 4% and was adjusted annually for inflation using the CPI Urban index. The portfolio was rebalanced annually to maintain the initial 50:50 asset allocation.
Andy created the table as a thought exercise to show the impact sequence of returns risk might have had on consumers retiring at the end of 1999. In theory, this illustration should offer a textbook lesson in sequence risk. However, as Andy notes, 26 years later, the portfolio has $85,000,264 more than when he initially retired. As an interesting aside, Andy noted that an inflation-adjusted withdrawal rate of 5% would just about deplete the portfolio in year 26.
As a long-time retirement researcher, I felt compelled to share my take-aways from the data because some of the commenters on the post reached flawed, overly optimistic conclusions.
The Outcome Does Not Dismiss the Impact of Sequence Risk
Investors (and advicers) who were not old enough to observe and financially experience the first ten years of this illustration might look at this and scoff at the threat posed by sequence risk. That is the naivete of decisions based on hindsight. In 2009, when the stock market was down more than 54% from its peak and the S&P 500 was 30% lower than it had been a decade earlier, future returns were far from certain. Policymakers openly confessed that they were not certain the measures they were taking would avert a global contagion. I assure you, no chart of historical returns provided any comfort to retirees at that time, and no one knew if or when the markets would recover. The remarkable returns from the stock market, paired with historically low interest rates from 2010 through today, were not pre-ordained.
A big part of the reason why most academic researchers use some form of Monte Carlos simulations in their retirement models is they know that future returns will not exactly mirror past returns. They know that the next major downturn will likely require a different playbook. Monte Carlo simulations enable users to illustrate and quantify the impact of potential outcomes that may be worse than the historical experience.
[NOTE: Most Monte Carlo simulation software that is used by financial planners today requires the user to make assumptions about future market returns and volatility. In my proprietary Nest Egg Guru retirement spending simulation software, I use “bootstrapping with replacement” as the simulation methodology. This form of Monte Carlo simulation does not require users to make explicit assumptions about the future returns and volatility, but instead randomly samples monthly return data from the stock market indexes.]
The Stability of Bonds in this Illustration May be Mirage
Some people may interpret the results as proof of the important stabilizing influence of bonds in the portfolio. We forget that interest rates steadily declined during this period (and the two decades prior). This is trend is not repeatable from current interest rate levels. The primary tool that was used to avoid contagion in the 2007-2009 economic crises was Quantitative Easing. The Central Bank’s purchases of treasury keep interest rates artificially low to stimulate the economy proved to be successful. However, with the current national debt at more than $38 trillion, some economists doubt that it would be effective in the next economic crisis, especially with interest rates already near historic lows.
2022 may serve as a harbinger of potential future outcomes in which interest rates are rising AND the stock maret is falling. As Andy shows, in 2022, the stock market dropped 18% and the bond market dropped 13%. That's not most retirees' idea of stabilizing. If the next prolonged downturn includes rising interest rates caused by high inflation, this table will quickly lose its teaching value. Mr. Bengen has updated his findings over time and regularly cautions investors that inflation is the greatest threat to consumers today. This table does not illustrate this risk, as it covers the lowest period of interest rates and inflation in moder U.S. history.
He invented the 4% rule of retirement income – why he calls inflation retirees’ “greatest enemy.” (CNBC 9/3/2025)
[NOTE: A solution to ameliorate inflation risk in bonds is to avoid bond funds and use money market funds and short term individual CDs/bonds instead. Readers of my content will know that I recommend this approach all the time.]
The S&P 500 Was Not the Most Volatile Widely Held Index in the 2000-2009 Time Frame
The period from 2000-2009 represented the worst 10 year period for the S&P 500 Index in modern history. It featured two prolonged declines of more than 50% from peak to trough. However, it was far from the worst performing index over that period. In fact, the Nasdaq Composite Index ,which investors purchase in ETF format under the symbol QQQ, peaked at 5,000 on March 9, 2000 – the very zenith of the dot.com bubble. From that date through October 10, 2002, QQQ lost 78% of its value. It did not sniff 5,000 again until March 2, 2015. It was a widely held index in the 1990s, and it is even more widely held today. Had QQQ been substituted for the S&P 500 index in the table, the initial $1,000,000 starting retirement value would almost certainly would have been depleted.
The Illustration does NOT validate the 4% Rule as Model for Real World Spending
This illustration is actually useful for highlighting a fatal flaw in the "4% Rule." As Andy Panko illustrated, this portfolio survived the worst 25 year period in modern history and left $1 million at the end. In other words, the poor hapless folks who followed this mantra dramatically underspent in their retirement. This may be great news for heirs, but dying with a big pile left in retirement savings, may also mean that the retirees could have enjoyed their twilight years more. Retirement researchers have long known that adhering to a 4% static inflation-adjusted withdrawal rate will lead significantly oversized ending portfolio balances in all but the very worst investment outcomes. I wrote about this a couple years ao in an article titled, Why the 4% Rule needs to be "retired." The current leading edge of retirement research suggests that higher initial withdrawal rates paired with decision rules that allow for dynamic distribution planning in retirement should provide more optimal spending in retirement.
Conclusion The Past is NOT Prologue
Andy’s annual exercise of tracking the history of the 4% rule through the worst stock market bear market in the future is interesting because many researchers, including me, posited that workers who retired in the late 1990s, might run out money following the standard 30-year retirement spending period if they followed the 4% rule. It was impossible to tell when there were still 10-15 years left. Now that we are inside of 5 years remaining, it is becoming clearer that Bengen’s 4% spending model would not have been depleted. It is an interesting though exercise, but it does not mean that the 4% rule is optimal or should be followed in the future.
Consumers should know that retirement spending research has evolved significantly since Bengen’s 1994 paper. Today’s optimal spending models typically involve higher initial spending rates for retirees in their 60s with built in guardrails that curb spending during downturns and increase spending when the stock and bond markets are more robust. Investors looking at this data should understand that the past is not prologue and that the bogeyman we should fear is not a repeat of the 2000-2009 period, but rather different environment that involves a period of prolonged higher inflation in which a bear market in bonds is paired with a severe bear market in stocks. 2022 provided a brief glimpse of how such an environment might begin.
John H. Robinson is the founder of Financial Planning Hawaii and Fee-Only Planning Hawaii and a co-founder of retirement simulation software, Nest Egg Guru.